
If you've ever looked at your cycling data after a hard ride and noticed that your normalized power is significantly higher than your average power, you already understand the core problem NP solves. Riding outdoors, with hills, traffic, wind, and surges, is nothing like holding a steady 200 watts on a trainer.
Normalized power (also written as normalised power) is the metric that accounts for that variability and gives you a more accurate picture of how hard your ride actually was.
What Is Normalized Power in Cycling?
Normalized power is a weighted measure of your cycling power output that reflects the true physiological cost of a variable-effort ride. While average power treats every watt equally, whether you're sprinting at 500W or coasting at 0W: normalized power applies a mathematical weighting that emphasizes harder efforts, because the body's energy systems don't respond linearly to power.
In plain terms: a ride with lots of surges, sprints, or climbs feels and stresses your body more than a steady ride at the same average watts. Normalized power captures that "felt effort" in a single number.
The concept was developed by Dr. Andrew Coggan and introduced through TrainingPeaks as Normalized Power® (NP®).
It's now the foundation of two other critical training metrics: Intensity Factor (IF) and Training Stress Score (TSS).
« Normalized power is best understood as: «the power you could have sustained at a constant effort for the same physiological cost as your variable ride.» »
Coggan A (2003). Training and Racing Using a Power Meter. Formally published in Allen H & Coggan A, Training and Racing with a Power Meter, VeloPress, 2006.
The physiological rationale is supported by peer-reviewed research: a 2020 study in Frontiers in Physiology confirmed that variable power output induces significantly higher VO2 and blood lactate than constant output at the same average power, validating the non-linear weighting at the core of the NP calculation.
How Is Normalized Power Calculated?
The calculation follows a specific 4-step algorithm:
-
Calculate a 30-second rolling average of your power data for the entire ride.
-
Raise each value to the 4th power: this is the key step that heavily weights harder efforts over easy ones.
-
Take the average of all those 4th-power values.
-
Take the 4th root of that average. The result is your Normalized Power.
The 4th power exponent is what makes the algorithm sensitive to spikes. A 400W effort doesn't count twice as much as 200W; it counts 16 times as much (400⁴ vs 200⁴).
That's intentional, because a hard sprint stresses your cardiovascular and metabolic systems far more than a linear ratio would suggest.
You don't need to calculate it manually. Every major platform (Garmin, TrainingPeaks, Wahoo, Strava) computes it automatically from your power meter data.
Normalized Power vs Average Power: What's the Difference?
This is the comparison that matters most for everyday training analysis.
| Metric | What it measures | Best used for |
|---|---|---|
| Average Power | The arithmetic mean of all power values, including zeros when coasting | Steady-state rides, TT efforts, trainer workouts |
| Normalized Power | The physiologically weighted effort of the ride | Road races, group rides, hilly routes, interval sessions |
Example: Two cyclists both ride for 60 minutes. Cyclist A does a steady 200W trainer session.
Cyclist B does a hilly outdoor ride averaging 200W, but with repeated climbs hitting 300–400W and descents at 0W. Both have the same average power; Cyclist B's NP might be 230–250W, reflecting the significantly higher physiological cost of the variable effort.
The greater the difference between NP and average power, the more variable, and typically more demanding, the ride was. This ratio is called the Variability Index (VI): VI = NP ÷ Average Power.
A VI of 1.0 is perfectly steady; a criterium or mountain stage might show a VI of 1.10–1.20 or higher.
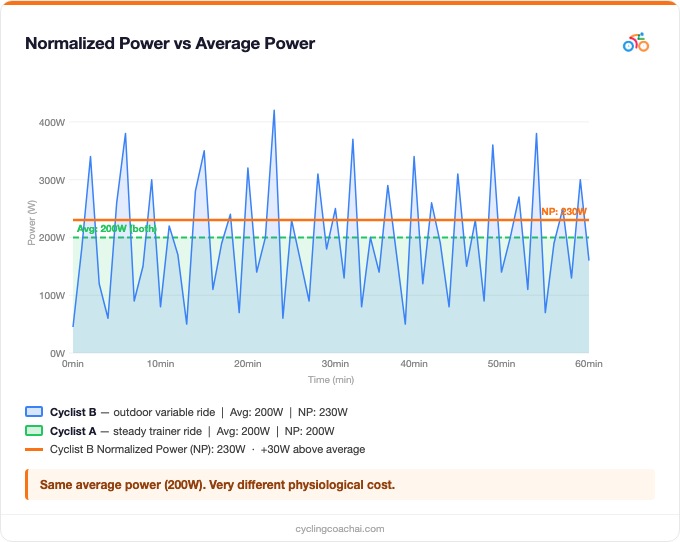
Same average power, very different physiological cost. NP captures what average power misses.
For a deeper look at how power metrics connect to your energy zones, see our guide to cycling power zones.
What Is a Good Normalized Power for Cyclists?
There's no universal "good NP" because it depends on your FTP, body weight, and ride context. The most meaningful way to evaluate your NP is relative to your FTP (Functional Threshold Power), specifically through the Intensity Factor.
That said, here are rough benchmarks by rider level for a 1-hour road ride:
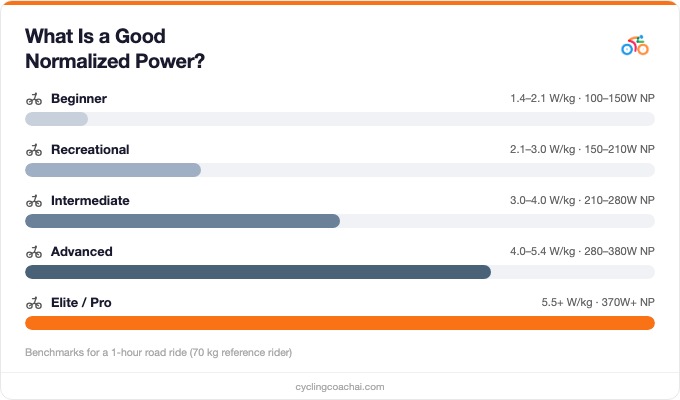
NP benchmarks by rider level for a 1-hour road ride (70 kg reference rider).
For most amateur cyclists, a sustainable 1-hour NP between 85–100% of FTP is normal. Anything consistently above 100% of FTP for an hour means either your FTP is outdated or you pushed very deep.
To understand your power-to-weight ratio in context, read our guide on watts per kilo in cycling.
How Normalized Power Connects to IF and TSS
Normalized power is the building block for two of the most useful metrics in structured training:
Intensity Factor (IF)
IF = NP ÷ FTP. It tells you how intense a ride was relative to your threshold.
An IF of 0.75 is a moderate endurance ride; 0.85–0.90 is tempo/threshold work; 1.0+ means you rode at or above FTP for the duration.
-
IF < 0.75: Easy / recovery
-
IF 0.75–0.85: Endurance / aerobic base
-
IF 0.85–0.95: Tempo / threshold
-
IF 0.95–1.05: Threshold / race effort
-
IF > 1.05: Short, very intense effort
Training Stress Score (TSS)
TSS combines IF and ride duration into a single fatigue number: TSS = (duration in seconds × NP × IF) ÷ (FTP × 3600) × 100. A 60-minute ride at IF 1.0 always equals 100 TSS: that's the baseline.
For a full breakdown, see our guide to Training Stress Score (TSS).
Without a correct NP, both IF and TSS become inaccurate, which is why NP matters so much to the integrity of your entire training load model. If you're using Cycling Coach AI to manage your training, these metrics feed directly into how your weekly load and recovery are calculated and adjusted automatically.
How to Find Your Normalized Power (Garmin, Wahoo, TrainingPeaks, Strava)
NP is calculated automatically by most platforms. You just need to know where to look:
-
Garmin Connect: Open the activity → scroll to the "Power" section → "Normalized Power" is listed there. Also visible on compatible Garmin head units after the ride.
-
Wahoo ELEMNT: Visible post-ride in the Wahoo app under activity details → Power summary.
-
TrainingPeaks: Every power-based activity shows NP, IF, and TSS automatically in the activity dashboard.
-
Strava: Strava calls it "Weighted Average Power" (WAP), which is functionally identical to NP. Available in ride details, though full access may require Strava Summit or syncing from a Garmin/Wahoo device.
-
Intervals.icu: Free platform that shows NP on every activity. Recommended for amateur cyclists who want TrainingPeaks-level analytics without the subscription cost.
Important: Normalized power requires a power meter or smart trainer. It cannot be estimated from heart rate alone.
How to Use Normalized Power to Train Smarter
Knowing your NP is only useful if you act on it. Here's how to apply it in practice:
1. Assess ride quality, not just volume
Two 2-hour rides at the same average power can have very different training stimuli. Compare NP, and especially VI, across rides of the same type to understand how consistent or variable your efforts are.
A criterium racer needs a high-VI tolerance; a time trialist needs to minimize it.
2. Track fitness progression over time
If your NP on your regular group ride is increasing while your perceived effort stays the same, your fitness is improving. NP is a more sensitive marker of fitness change than average power for variable rides.
3. Calibrate your FTP regularly
If your NP frequently equals or exceeds your FTP during long rides, your FTP estimate may be too low. An accurate FTP is the anchor for every metric downstream.
Use our cycling FTP test guide to keep it current.
4. Use NP to pace races and events
For gran fondos or sportives, targeting a specific NP relative to your FTP is more reliable than targeting average power. A hilly 3-hour ride at IF 0.78 tells you far more about sustainable pacing than "average 190W."
5. Let your AI coach interpret it automatically
Manually analyzing NP, IF, and TSS across every ride is time-consuming. Cycling Coach AI reads your ride data, interprets your NP trends, and adjusts your training plan accordingly, so you focus on riding, not spreadsheets.